TOP-SET Root Cause Analysis
The Kelvin TOP-SET® Root Cause Analysis method is an incident investigation methodology that follows all known best practices in this field. The method revolves around six elements: technology, organisation, people, similar events, environment and time. The planning of the investigation, but also the facts that are gathered during the investigation are categorised by these items.
The TOP-SET® methodology starts with an initial incident statement to set the scope of the incident. After that, the method basically follows three main steps: plan, investigate and analyse.
1. Plan
Planning is a very important step in the TOP-SET® method. The investigator is guided in the planning to make sure not a single possible factor of the incident is overlooked. The TOP-SET investigation planner provides you with a list of all possible factors making sure that the investigator has a broad perspective on the incident.
2. Investigate
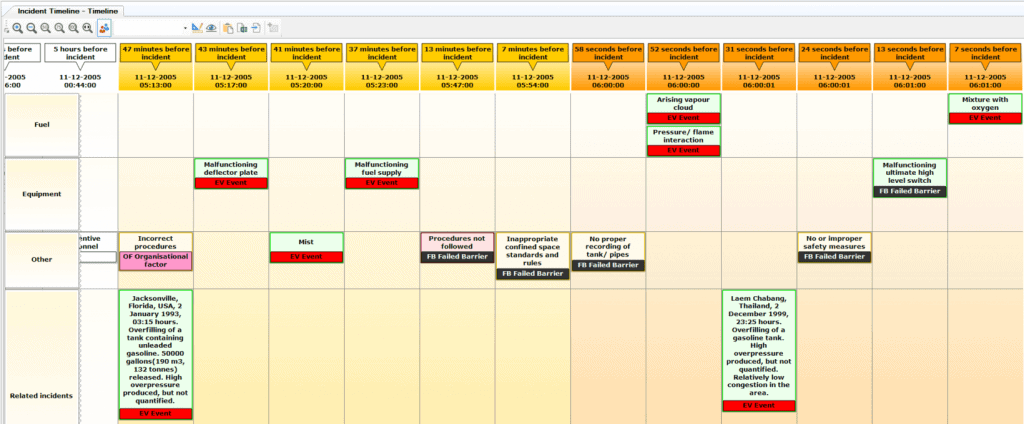
In this part of the investigation, all actors contributing to the incident are investigated. Witnesses are interviewed, the incident scene is visited, pictures are taken and simulations are performed. During the Kelvin TOP-SET® course, all these techniques are taught (more information can be found on www.kelvintopset.com). When all facts are gathered they are gathered on a storyboard and categorised in the six main elements. The storyboard items can be of different colours showing the credibility of the item or the investigator that added it. Since time is an important element, the storyboard can also be transformed into a timeline.
3. Analyze – root cause diagram
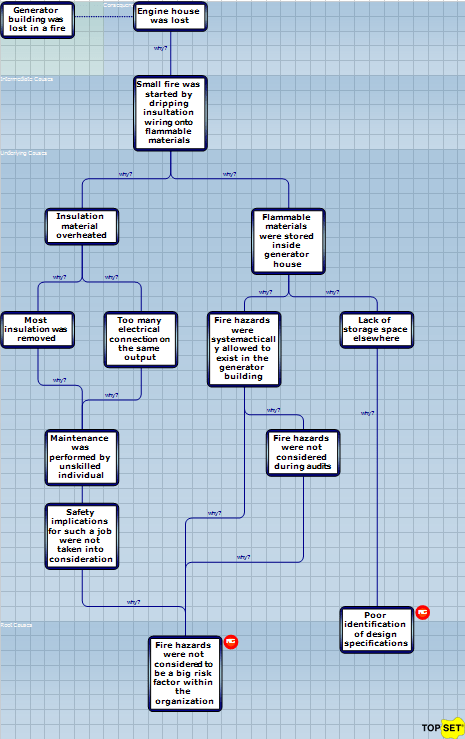
When all facts are gathered the investigator can look at the causes of the incident. In the TOP-SET® method, this is done through a root cause diagram. The diagram starts with identifying the immediate causes, then the underlying causes (failed barriers) all the way to the root causes. These root causes represent the latent failures of the organisation. When these failures are resolved the incident will be prevented in the future together with a scope of similar incidents.
Investigate an incident in 4 steps with the Kelvin TOP-SET method
BSCAT
BSCAT links the barrier-based bowtie concept to DNV GL’s concept for incident investigation: The Systematic Cause Analysis Technique (SCAT). SCAT provides a framework with predefined categories of direct and basic causes that have proven to be important contributions for incidents in multiple industries. By applying this SCAT technique on a barrier, one can assess the performance of barriers during an incident and come up with specific improvement actions that address the basic causes of failure. The BSCAT concept supports complex incident investigations that are characterised by a variety of events that went wrong.
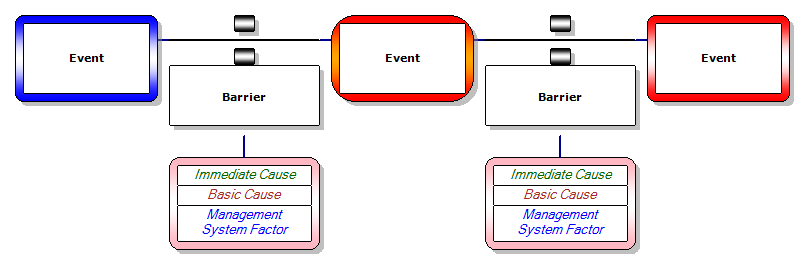
Applying the widely used SCAT method onto safety barriers with BSCAT
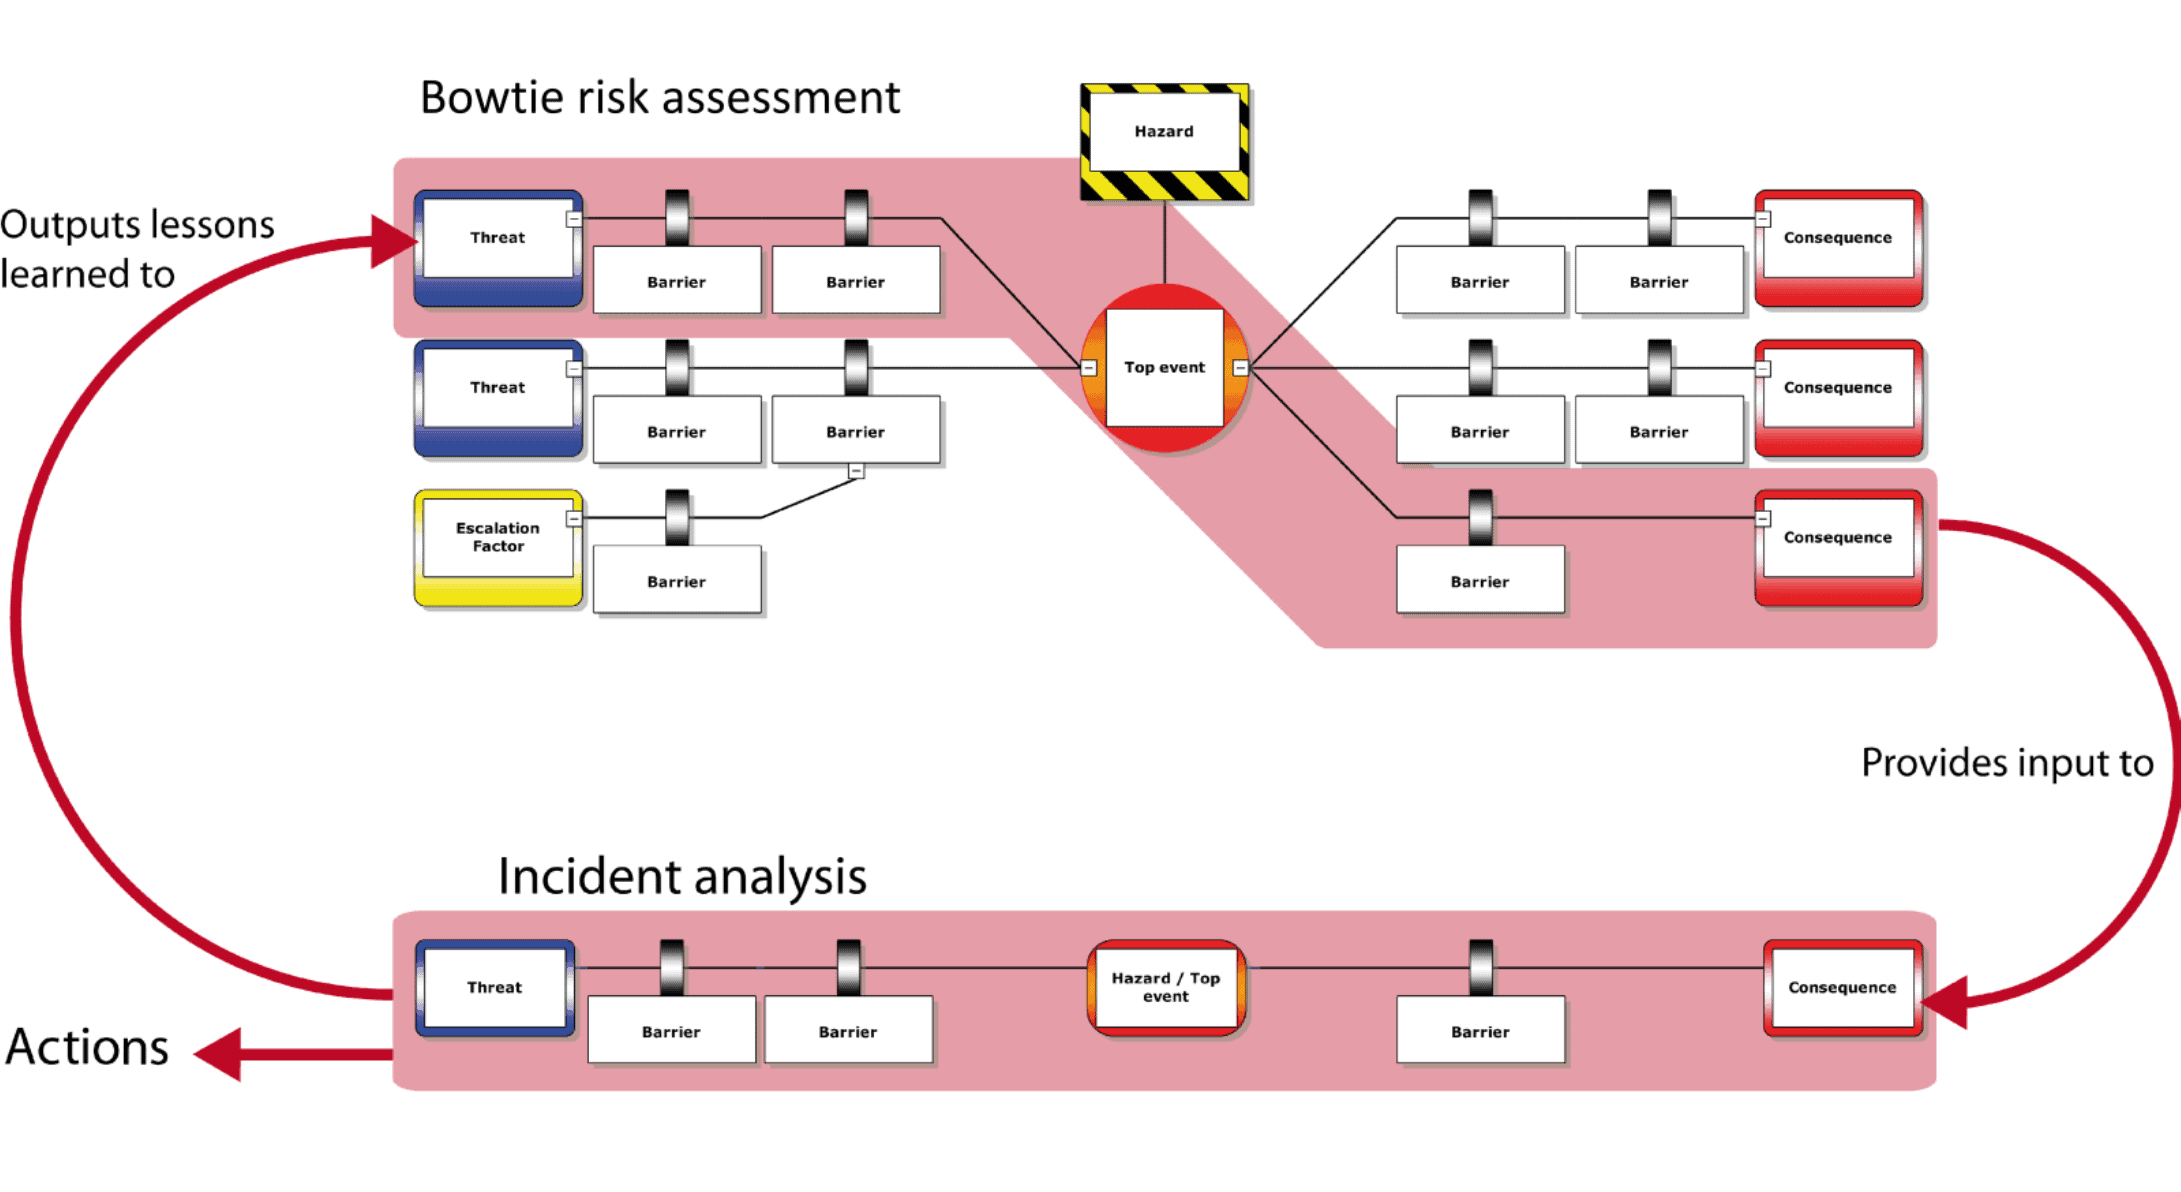
Linking incident analysis and risk assessment
The BSCAT method can utilise pre-existing bowties or can be used on its own. It was the first method to complete the Deming circle and link risk assessments with incident analysis. BSCAT is built on top of the BowTieXP platform.
Tripod Beta
The Tripod Beta method is a way of conducting an incident analysis specified for high risk and complex incidents since it is a very extensive and detailed method. Training is highly recommended when using the Tripod Beta method.
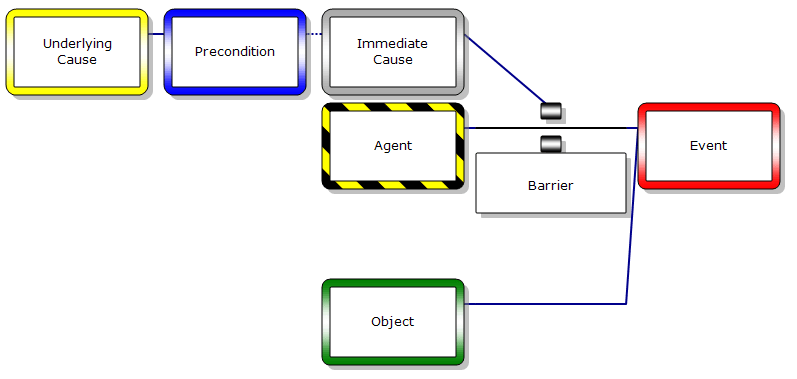
Chaining events and barriers in Tripod Beta
Building a tripod tree
A tripod tree is built in three steps. The first step is to ask the question: ‘what happened?’. All the events that happened in the incident are listed as a chain of events. The next step is to identify the barriers that failed to stop this chain of events. The question that is asked in this step is: ‘How did it happen?’. When all the events and the failed barriers in between are identified, the reason for the failure of these barriers is analysed. The last question for this step is: ‘Why did it happen?’. For each of the failed barriers, a causation path is identified.
A more detailed explanation of the elements that compose the Tripod Beta diagram are explained in our knowledge base article.
Tripod Beta in IncidentXP
IncidentXP allows the user to easily create a full Tripod Beta diagram, with various useful features that will make the analyst’s job a lot easier.
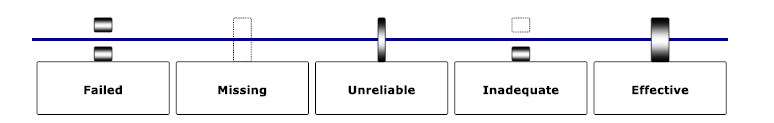
Barrier failure modes
Within IncidentXP it is possible to indicate within the diagram why a barrier failed. An example of such barrier failure mode is the ‘inadequate barrier’: a rare type of a failed barrier that is used when a barrier functioned as intended by its design, but was unable to stop the sequence of events. It indicates an issue with the design specifications.
Full control over diagram layout
As any tripod analyst will tell you, creating a Tripod Beta incident analysis diagram is an iterative process. Sometimes new facts found in the investigation will shed new light on the incident and will require the analyst to rethink the diagram. This means that the diagram needs to be adjusted. Within IncidentXP you can easily add new components to your diagram and it can easily be rearranged.
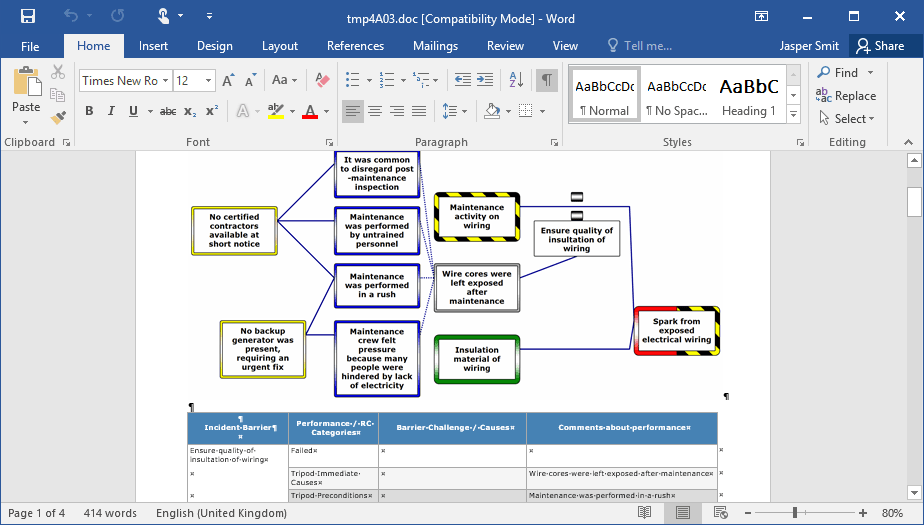
Graphical reports
Within IncidentXP it is possible to make fully graphical cut-out reports. This report breaks up a tripod diagram in its individual trios and discusses the failure mode of each represented barrier. These reports can be customised with company logos, title pages, tables of content and custom chapter numbering like in a regular Word document.
>Barrier Failure Analysis (BFA)
BFA is a pragmatic, general-purpose incident analysis method. It has no affiliation with any particular regulatory organisation, so doesn’t contain any predefined lists in comparison to BSCAT. BFA is a way to structure an incident and to categorise the elements of the diagram according to incident analysis taxonomy. The structure offers events, barriers and causation paths. Events are used to describe a causal sequence of unwanted events. This means each event causes the next event. It is also possible to have parallel events that in combination cause the following event.
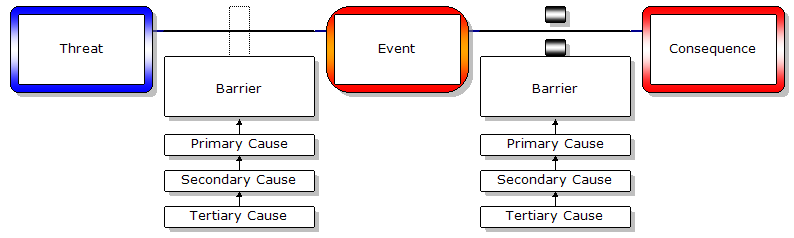
Analyze which and why barriers failed
Barriers are used to highlight certain parts of our environment as being designed to stop a chain of events. They are not necessarily independent, or sufficient. Since the unwanted events still happened, causation paths are added to explain why the barriers didn’t function properly. The causation path goes three levels deep. The levels are simply called primary, secondary and tertiary level. These labels can be changed according to your organisational standards, but the idea is that a barrier can be analysed in three causal steps. It does not specify whether the analysis should end on an organisational level or not, although this is what would happen most frequently.
Create causation categories to analyse trends
Each level in the causation path can also be categorised. But by default, there are no categories defined. As there is an infinite number of possible categorisations and a large number of different types of organisations, it is not possible to create one standard of categories that would apply to all. Moreover, it allows creating custom categories. Any organisation should go through an initial period of testing and iterating categories. At some point, a steady state should emerge that will capture most incidents, but there will always be exceptions. Once exceptions happen more frequently, they stop being exceptions and should be integrated into the existing categorisations in a new iteration of the taxonomy.
After trends have been spotted, actions can be taken for long-term risk management approach.
Why Barrier Failure Analysis?
There are several reasons to choose for Barrier Failure Analysis:
- Barrier-based analysis methodology
- Plot incidents onto the proactive bowtie risk assessment diagrams
- Bowtie risk assessment can be used to check if the incident analysis covered everything
- Customizable causation categories
- Generate actions to improve your current risk situation (short-term) and risk analysis (long-term).
Root Cause Analysis (RCA)
RCA is a straightforward incident analysis technique. It starts with an incident and drills down into the chain of events that led to that incident until the root causes are identified. This method is widely used throughout the world, and the idea of drilling down to the root cause is also present in all of our other incident analysis methods. However, a traditional root cause analysis has the potential to turn into a jumble of elements. We felt this could be improved, so we did two things.
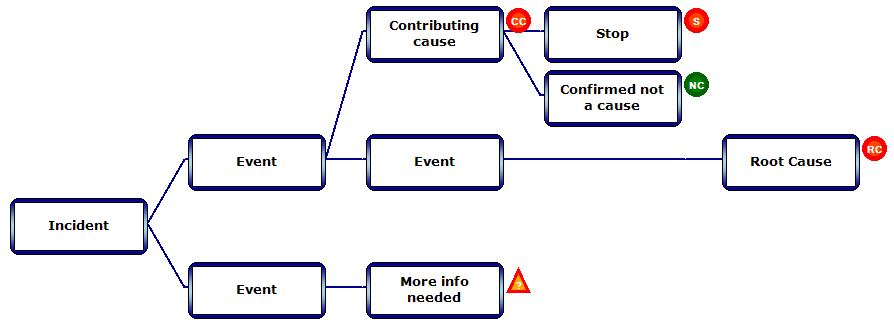
Identify events and root causes in RCA
Improved RCA categories and cuts
First, we added some more subtle categorisations so you can see at a glance where the real problem areas are. You don’t need to use them, but if you do we think you will create better analyses, making it easier for your audience to see what you’re trying to communicate. Second, you can cut up a large diagram into smaller pieces and link them together. Separating the main diagram from sub-diagrams avoids a situation where the diagram becomes so large you lose the overview.
Barriers or RCA
The main difference between RCA and our other incident analysis methods is that RCA is not barrier-based. In RCA everything is an event, while some of these events would be considered barriers in BSCAT, Tripod Beta or BFA. It is no problem if you just want to use RCA, but there is one thing to keep in mind. Whereas the barrier-based incident analysis methods like BSCAT and Tripod Beta can be mapped back onto the bowtie due to their similar (barrier) structure, RCA is not able to provide this link. The bowtie structure depends heavily on identifying barriers, which is not the case in RCA.


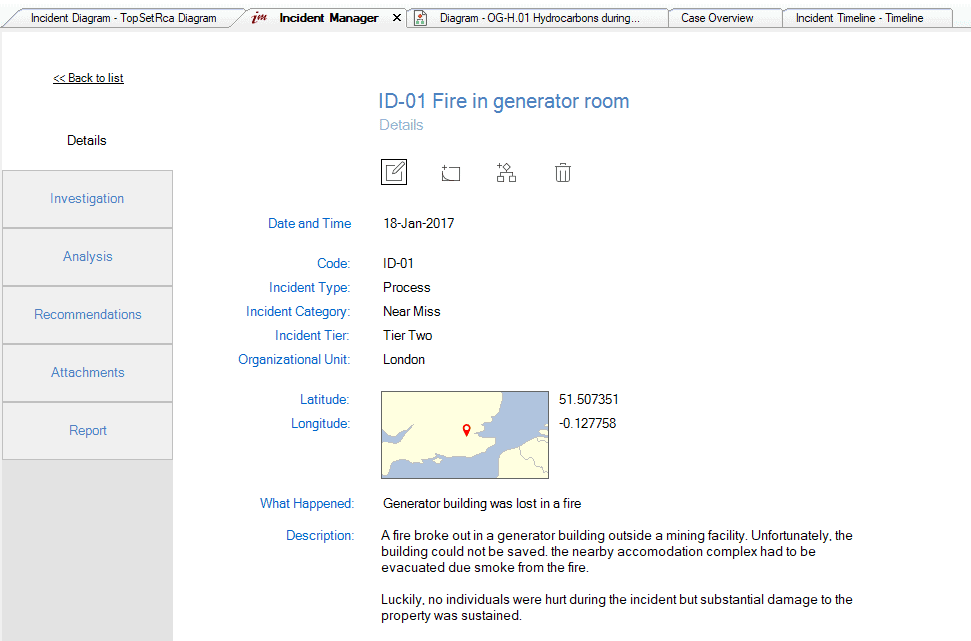
 Organize evidence